
One Platform, Both Sides of the Ball: How ROAR’s SmartDaaS Integrates Player Performance and Business Intelligence for Sports Organizations
By Adam Grossman
Sports business intelligence teams have spent years managing two separate worlds. On one side, player evaluation: scouting reports, performance models, roster projections, and draft analysis. On the other, business operations: sponsorship valuation, ticket revenue forecasting, fan analytics, and real estate strategy.
The result is often a persistent gap in how sports organizations make decisions. A front office evaluating a trade has limited visibility into the revenue implications of acquiring or losing a player. A business development team pricing a sponsorship has limited access to the on-court performance models that drive the value of that partnership. The data exists on both sides, but the connection between them does not.
ROAR has built its Smart District As A Service (SmartDaaS) platform to close that gap. SmartDaaS is a single, integrated solution that combines proprietary on-court player performance models, for both the NBA and WNBA, with off-court business intelligence, sponsorship analytics, fan engagement tools, and real estate development capabilities. Rather than forcing organizations to stitch together separate vendors for player analysis and business operations, SmartDaaS delivers AI-driven insights across both domains in one platform.
ROAR’s Proprietary On-Court Models: The WinsReg Framework
At the core of SmartDaaS’s player evaluation capabilities is a proprietary framework ROAR has built to quantify individual player contributions to team wins. The model primarily uses True Shooting Percentage (TS%), Defensive Box Plus/Minus (DBPM), and Turnover Percentage (TOV%) as its key drivers given these three variables have the highest correlations to winning basketball games.
Each player receives a WinsReg score representing his contribution to team wins. Summing those scores across a roster produces a projected team win total, and the gap between projected and actual performance reveals where rosters are outperforming or underperforming their talent.
ROAR has built these models for both the NBA and the WNBA, giving clients the ability to evaluate player performance across both leagues within the same platform. The model does not just rank players. It also identifies the specific positional weaknesses on every roster, the type of player each team should target, and the most realistic acquisition path based on a team’s competitive position.
2025-26 NBA Season: What the Model Reveals
Applying ROAR wins model to the current NBA landscape produces actionable insights for every team in the league.
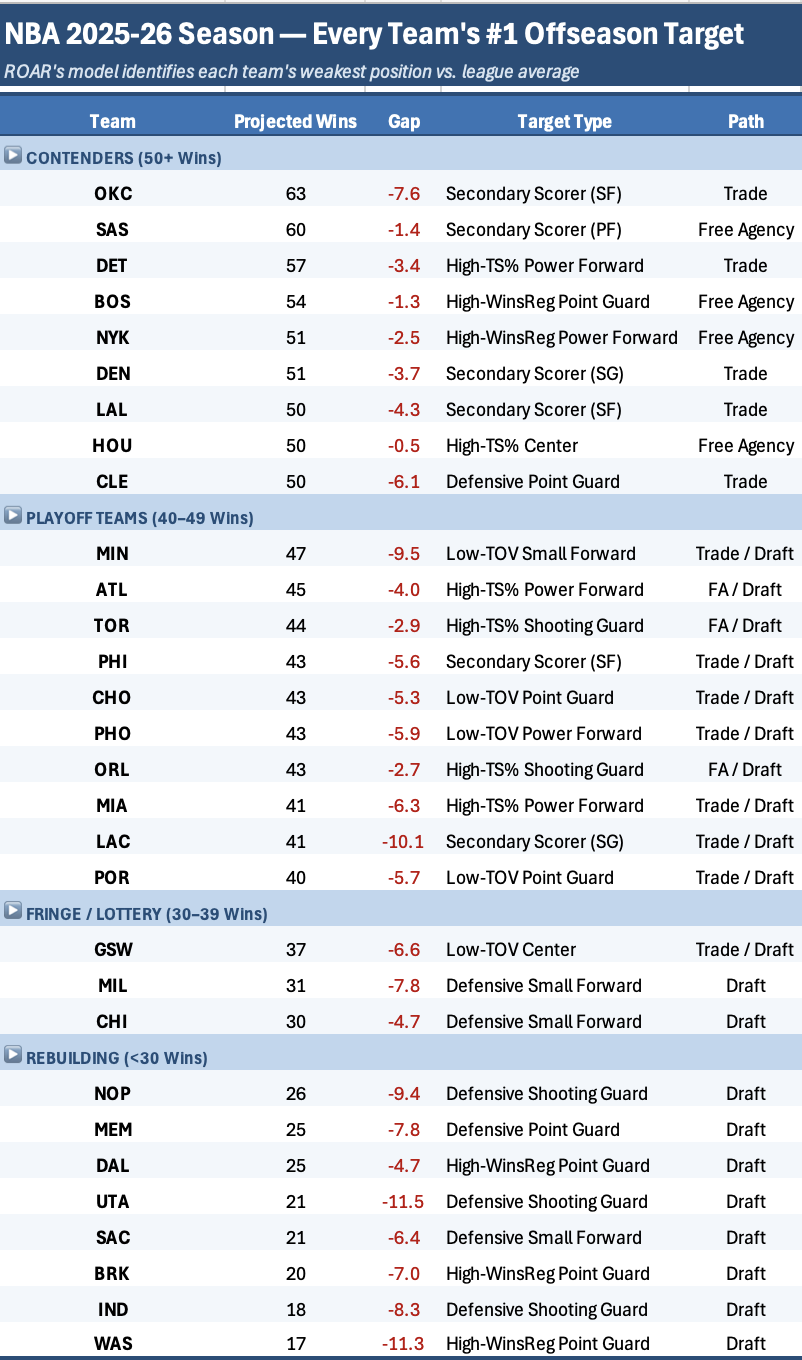
For example, Shai Gilgeous-Alexander leads the league with the highest individual WinsReg score at 17.8, with an 8.6-point gap to the next player on his roster. Oklahoma City’s projected 63 wins are the highest in the league, but the model identifies small forward as a position where the Thunder trail the league average by 7.6 wins — making a secondary scorer at that position the top free agency, trade, or draft acquisition target.
At the other end of the standings, defensive deficiency is the dominant theme for teams projected below 30 wins. Utah (−1.71 DBPM) and Sacramento (−1.25 DBPM) are team defensive metrics well below league average, and no single player on those rosters can anchor a defense alone.
Every Team’s #1 Offseason Target
The table below, derived from ROAR wins model, identifies the weakest positional gap for all 30 NBA teams, the type of player each team should target, and the recommended acquisition path based on competitive tier.
Our methodology includes:
Gap equals a team’s WinsReg at its weakest position minus the league average. More negative means a bigger need.
Acquisition path is based on win-total tier: contenders pursue trades and free agency, playoff teams use a mix of trades and the draft, and rebuilding teams rely primarily on the draft.
The SmartDaaS Advantage: On-Court and Off-Court in One Platform
The insights above represent only the on-court side of what SmartDaaS delivers. Within the same platform, a client evaluating a player acquisition can simultaneously model the business impact of that move on ticket revenue, sponsorship activation, real estate development, and venue strategy. A front office assessing whether to trade for a secondary scorer at small forward can see not only how that player’s wins score affects projected wins but also how his presence changes the revenue profile of the franchise.
That level of integration does not exist elsewhere. Many analytics providers offer player performance tools or business intelligence tools, but not both. SmartDaaS delivers player evaluation, revenue modeling, and real estate analytics together. This creates a fully integrated decision-making environment where on-court performance and off-court business value are connected rather than siloed.
For sports organizations, this means the same platform that identifies a team’s weakest roster position can also model the sponsorship value of the player acquired to fill it, forecast the impact on ticket demand, and assess how that move fits into a broader district or arena development strategy. Combining AI-driven on-court and off-court models in a single solution is unique to ROAR.